
An Electoral System in Crisis
lulu Fries’dat & Anselmo Sampietro
in collaboration with
Fritz Scheuren
July 25, 2016
Excerpt
An Electoral System in Crisis, is a 39-page independent in-depth examination of the accuracy and security of U.S. electronic voting equipment. This research has been invited for publication in the Journal of the International Association of Official Statistics (IAOS). Due to the unusual time constraints of the primary election cycle, and the right of the public to have access to this information, the authors are taking the unusual step of publishing ahead of time online. The full report is now available online at the website of the co-author’s documentary; and will be posted in a number of locations including the forum of The American Association for Public Opinion Research, and the forum of Social Research Methods. Below is a summary of our findings. We encourage everyone to download and read the full report.
The Research
Having confidence in our elections is central to our faith in our government, and all the decisions that we make collectively as a nation. But are the candidates who win the ones that we actually vote for? A large and growing body of research provides convincing evidence that U.S. electronic voting equipment in many parts of the country may not be counting votes accurately. This could be due to malfunctioning computer equipment that in 43 states is over a decade old, and long past its natural life. However, in many cases, the data points toward fraud as a likely explanation.
The documentation consists of statistical graphs analyzing data from five presidential cycles, as well as off-year races from across the country. The data illustrates that there are unusually large discrepancies between small precinct and large precinct election returns, and noticeable differences between hand-counted and machine-counted precinct results.
In our research we examined the election results of the 2016 presidential primaries, and found irregularities in the overwhelming majority of the twenty-one states that we analyzed. The data indicates, in particular, that the totals reported on the Democratic side in the race between Hillary Clinton and Bernie Sanders may not be correct. In state after state, independent examination by two separate analysts found suspect statistical patterns giving Clinton inflated percentages, that in all likelihood, are not fully based on actual votes, and showing Sanders with what appear to be artificially depressed totals.
The difference between the reported totals, and our best estimate of the actual vote totals, varies considerably from state to state. However, these differences are significant—sometimes more than 10%—and could change the outcome of the 2016 Democratic presidential primary. We found irregularities in the 2016 Republican presidential primary as well, and while concerning, we do not believe they are large enough to change the outcome of that race. It is important to note that the fact that a candidate benefits from irregularities does not imply that a candidate is responsible for them.
Fritz Scheuren, a member of the statistics faculty at George Washington University, and a former president of the American Statistical Association, has been a collaborator in this research. Examining the data from the study, Scheuren said, “As a statistician, I find the results of the 2016 primary voting unusual. In fact, I found the patterns unexpected [and possibly even] suspicious. There is a greater degree of smoothness in the outcomes than the roughness that is typical in raw/real data.”
The underlying analysis for this research was presented in an article by Beth Clarkson in the Royal Statistical Society journal, Significance. This method was also covered in a number of other scientific papers and blogs, some of which were weakened by incorrect assumptions and flawed analysis. This research is the most comprehensive and academically rigorous treatment of the material that has been published to date, using blind replication of the data by more than one statistician and verification by respected members of the academic statistical community.
An Environment of Corruption
The portrait of an electoral system in crisis is further supported by reports from election integrity organizations, media outlets, and individuals on social media that voting is increasingly taking place in a corrupt environment. This contextual evidence of voters purged from the rolls, registrations lost in the mail, party registrations being changed without a voters’ knowledge or intent, voters being sent incorrect ballots, a shortage of ballots, polling places being closed, discouragingly long lines in targeted precincts and states, and disturbingly large disparities between initial exit polls and official results, lends credence to the argument that if one form of fraud is already in play, another form of fraud is more plausible. This information is being aggregated by election integrity groups such as Election Justice USA, through voter testimonials and lawsuits that are in progress around the country.
Figure 1 is an example of a disenfranchised voter from the 2016 presidential primaries. Stories like this have been ubiquitous in many states, including Arizona, New York and California. More of these instances are documented in this article on Heavy.com.
Fig. 1 — Facebook post: Becky Dillon, a California voter forced to vote via provisional ballot, June 7, 2016
Difference Between Hand Counts and Machine Counts
If voting-machine results were inaccurate on a regular basis, there would be some evidence of it. One indicator would be that votes counted by machines would give different results than votes counted by hand. In fact, this is now being seen in elections all over the country.
In the 2016 Democratic primary in Kings County, New York (Brooklyn,) a group of affidavit ballots were hand-counted by a group of volunteers. Comparing the hand-counts with the machine-counts, there is a noticeable difference (Figure 2). In every single assembly district we examined, except one, Hillary Clinton performed better when the votes were counted by machine; Sanders performed better when the votes were counted by hand. The graph shows eight of the districts that were included in the study. This is a small sample of the overall ballots cast, but the consistency of the results makes a convincing case that something is amiss.
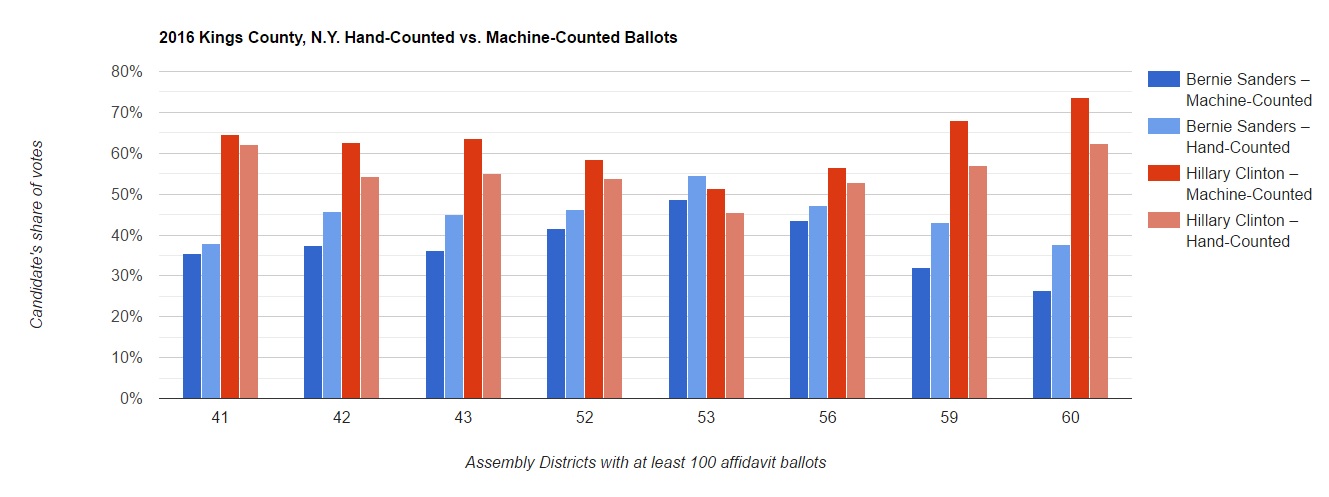
Fig. 2 — 2016 NY Democratic presidential primary
Hand-counted ballots show a higher return for Sanders
Graph by Anselmo Sampietro
Hacking
J. Alex Halderman teaches computer and network security at the University of Michigan and has successfully compromised numerous voting systems. He paints a vivid and unnerving description of one hack, “Within 36 hours of the system going live, our team had … almost total control of the server software, including the ability to change votes and reveal voters’ secret ballots.” Halderman points out that the threat to our elections could be coming from political players inside our country—or even from abroad. Testifying before the D.C. Board of Ethics and Elections about one of his many voting-machine hacks, Halderman makes it clear that the risks are not theoretical. “While we were in control of these systems we observed other attack attempts originating from computers in Iran and China. These attackers were attempting to guess the same master password that we did. And since it was only four letters long, they would likely have soon succeeded.”
You can view Dr. Halderman performing a successful hack on a voting machine in this clip from the documentary “Holler Back — [not] Voting in an American Town.”
Difference Between Small Precincts and Large Precincts
We will now focus on statistical irregularities, and by that we mean results that defy statistical laws. The technique we are using is called the “Cumulative Precinct Vote Tally Chart,” also known as a CVT (cumulative vote tally) graph. The CVT graph shows the precincts added together cumulatively from the smallest to the largest along the X-axis. On the Y-axis it shows the two candidates’ percentages. Columbia County, New York — a hand-counted county — shows a pattern that follows the statistical principle called The Law of Large Numbers (Figure 3). This graph illustrates the expected statistical pattern – on the right hand side, it flattens out. That is because by the right side of the graph, so many precincts have been added together that the pattern demonstrates the candidate’s average percentage of support.
Fig. 3 — 2016 New York Democratic presidential primary, Columbia County
This hand-counted county follows the expected statistical pattern
Graph by Anselmo Sampietro
In this graph, there is a large degree of fluctuation both up and down on the left side of the graph. Then, by about 1,300 votes, the graph settles into a fairly even straight line, with small, random fluctuations. It maintains a basically flat line through all of the largest precincts. This is a very normal-looking CVT graph.
Many states in the 2016 primary did not follow this expected statistical pattern, but exhibited various irregularities instead. For example, in Illinois, the statistical pattern shows a strong correlation between candidates’ percentages and precinct size (Figure 4). The smooth ascension of Clinton’s percentages as the precinct sizes increase is suspect. In our report we reviewed many factors, including demographic factors, but could not find a plausible explanation for these large differences between the expected statistical pattern and the reported vote totals. In all likelihood our research indicates these patterns are a sign of manipulation.
Fig. 4— 2016 Illinois Democratic presidential primary
Candidates’ percentages in small and large precincts are very different
Graph by Anselmo Sampietro
Figure 5 shows a graph of the 2016 Louisiana Democratic Primary. The analysis is by Beth Clarkson, a quality control engineer with a doctorate in statistics, and Anselmo Sampietro confirmed its accuracy.
Fig. 5— 2016 Louisiana Democratic presidential primary
Candidates’ vote shares vary by as much as 36% between small and large precincts
Graph by Beth Clarkson
This graph is in complete violation of the Law of Large Numbers. For a candidate to receive this level of increased support in the large precincts, each new precinct must be so heavily weighted that it defies the average of all the other precincts that have already been added together. This is a major statistical irregularity. In the small precincts, the difference between Clinton and Sanders is approximately 10% (Clinton 48%–Sanders 38%). However, in the largest precincts the difference between the candidates is 46% (Clinton 70%–Sanders 24%.) That is a difference of 36% support between the smallest precincts and the largest precincts.
The 2016 Primary
The majority of the data we examined suggests that the two candidates currently slated to accept their party’s nomination in the 2016 presidential primary races, received a different number of votes than what has been officially reported.
On the Republican side, statistical analysis indicates that Donald Trump probably received more votes than what has been reported and certified. Because he was able to overcome his opposition, even with the irregularities, his selection as the presumptive Republican nominee is supported by the data.
As we stated in the opening, this is not the case on the Democratic side. The overwhelming majority of the almost two dozen states that we analyzed, demonstrate irregularities. We found suspect statistical patterns in the 2016 Democratic presidential primary in Alabama, Connecticut, Delaware, Florida, Georgia, Illinois, Kentucky, Louisiana, Massachusetts, New York, North Carolina, Ohio, South Carolina, Tennessee, and West Virginia. These irregularities were significant, as we demonstrate in Louisiana, sometimes as large as 36% and could change the outcome of the election.
In almost every instance the discrepancies favored Hillary Clinton. In all likelihood the current results have assigned her a greater percentage of the vote than she may have actually received, while simultaneously under-reporting Bernie Sanders’ legitimate vote share.
We intend to report on the percentage that the race may be off, based on a statistical analysis of as many states as possible.
Recommendations
It is hard to conceive of a legitimate transfer of power following an election that has been this flawed. We recommend that many of these elections be examined, and if found to be inaccurate, decertified. Where paper ballots are available, it would be informative to count them by hand. Hand counts, historically, have also been subject to election fraud, so the protocols must establish a secure process that is open to the public, invites media scrutiny, and has strong chain-of-custody.
We understand that this is unprecedented. While the U.S. does have a long history of election fraud, we do not believe it has ever been this well-documented prior to the end of the election cycle.
Philip B. Stark, a statistics professor at UC Berkeley, who has been instrumental in designing new auditing techniques for elections agrees that, “Closer scrutiny of elections is necessary and welcome … that requires a paper trail, convincing evidence that the paper trail is complete and accurate, and a risk-limiting audit of the paper trail or a full manual tally to provide convincing evidence that the paper trail matches the announced result.”
Beth Clarkson adds, “It’s possible that to do a good audit would be more expensive and less transparent than a hand count.”
Securing Our Democracy
The lack of accuracy in our elections is truly a betrayal of our ancestors who fought and died for the democratic process. It is a betrayal of the soldiers who lost their feet to amputation in the Valley Forge winter. It is a betrayal of the women who went to prison and starved themselves to join the franchise. It is a betrayal of the civil rights workers who died for the right to register to vote. There can be no debate about whether or not the vote is accurate. We must know that it is accurate the way we know that the Earth revolves around the sun and not vice versa.
The people who win these elections will decide whether or not we go to war, how many people get what jobs, where our children attend what quality schools, the quality of the air we breathe and the water we drink, and so much more. The entire identity of our nation rests on our self-image as a self-correcting democracy whose leaders are accountable to the voters that elect them. To not know with 100% confidence that those leaders are the leaders that we actually voted for is the very essence of an existential crisis. This is a state of emergency. We must move rapidly to secure the integrity of the vote.
We need to immediately implement robust audit procedures. Then, as rapidly as possible, we must join the other legitimate democracies of the world and implement a system of paper ballots, hand-counted in a secure process that is open to the public, invites media scrutiny, and has strong chain of custody protocols. In this way, we can achieve accurate, verifiable results. Each citizen of the United States, and indeed the world, deserves this from us.
We encourage you to download and read the full report.
About the Team
lulu Fries’dat is an Edward R. Murrow award-winning journalist and documentary filmmaker. She received a Best Documentary award for her first feature-length documentary (producer/director) Holler Back — [not] Voting in an American Town, a film that explores systemic issues in our elections that discourage voter participation. Clips are available for viewing here. Her network news experience includes editing assignments for CBS Evening News, Nightline, Sunday Morning, The Today Show, and Good Morning America. She produced and edited profiles of Democratic candidates for MSNBC, and has done long-format documentary work with NBC News and CNBC. She was on the editing team of Gideon’s Army, an Emmy-nominated documentary that follows the personal stories of public defenders in the Deep South. Her full bio is available here. Follow her on twitter @shugahworks.
Anselmo Sampietro holds a Master of Statistics degree from the University of Bologna, Italy and has also studied at the University of Technology Sydney, in Australia and the University of Warsaw, in Poland. He currently leads a team of data analysts for a company based in London, UK. He collaborated (through InnoCentive) with General Fusion, a Canadian start-up that is developing clean and reliable nuclear fusion reactors, to build a statistical model predicting plasma performance. He has specialized in the use of statistical analysis software R, the analytic tool used throughout this article.
Fritz Scheuren is a Senior Fellow and Vice President at NORC in the Center for Excellence in Survey Research. Scheuren has an unparalleled record of work on complex substantive tasks related to sampling and to the analysis of data from government agencies and private sector institutions. Scheuren also serves on the Statistics Faculty at The George Washington University. At GWU, he created a successful survey sampling certificate program which he still teaches. Most of his over 450 applied and theoretical papers, presentations, monographs, and books are on sampling aspects of data collection primarily in a survey context. Scheuren served at the 100th President of the American Statistical Association (ASA) and chaired the ASA Sections on Survey Research Methods. He is a Fellow of the American Statistical Association and the American Association for the Advancement of Science (AAAS.)
Election Justice USA – the paper was assisted in its research and development by Election Justice USA, a national non-partisan organization of seasoned election integrity experts, statisticians, attorneys, journalists and activists, whose mission is to make sure each American's right to vote can be exercised without issue in accurate and honest elections.